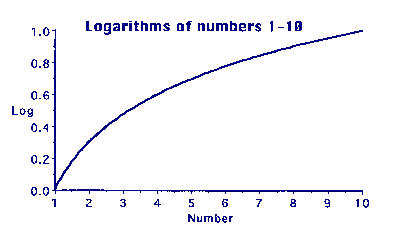
Graph 1: Logs of numbers 1-10
It is difficult for us now to appreciate the sheer grinding tedium of performing arithmetical calculations using only pencil and paper. Calculations to work out the logarithms of numbers and trigonometric functions were particularly horrible and any means of reducing the amount of labour involved was eagerly sought. Some of the methods used might seem strange to modern eyes.
One method used was to calculate only a few of the values required using the correct but tedious method and then to fill in the gaps in between using other techniques that required less effort to calculate.
The trick was to find some other function that gave the right sort of answers or the correctly shaped curve, without having to do masses of horrible calculations.
One such function was the polynomial.
Roughly speaking, something that has x, x2, x3, x4, ... in it. In practice only the lower members of the family are important here. An example would be something like:-
x3 + 7x2 + 3x + 4
In a function like this, x can have any value we chose for it. For instance, when x=2 this function has the value:-
(2 × 2 ×2) + (7 × 2 × 2) + (3 ×
2) + 4
= 8 + 28 + 6 + 4
= 46
If we want x to be equal to 5, then the function will have the value:-
(5 × 5 × 5) + (7 × 5 × 5) + (3 ×
5) + 4
= 125 + 175 + 15 + 4
= 319
If we work out the value of the function for lots of values of x and then plot the results on graph paper, we see a curve.
So what?
The point is that by carefully choosing the numbers in the function, the curve can be customised to fit quite well to a part (not all) of a log or trig function.
The general technique is to multiply the higher powers of x by a very small number - these become important on the right of the curve. The lower powers are multiplied by rather larger numbers and may be added or subtracted to get the best fit. Finally, a constant may be added or subtracted to shift the whole curve up or down.
For instance, using logarithms as an example, Graph 1 shows a
plot of the logs of numbers from 1 to 10. The curve gradually
changes and flattens as the numbers increase. Today, using a
computer,it is easy to produce such a graph, but it is very
difficult and time consuming to calculate the points by hand.
What we need is something else that gives the same shape of graph
but is easier to calculate.
Graph 2 shows the same log plot and also a plot of the polynomial:-
0.0038823x3 - 0.060157x2 + 0.40224x - 0.29289 (Function#1)
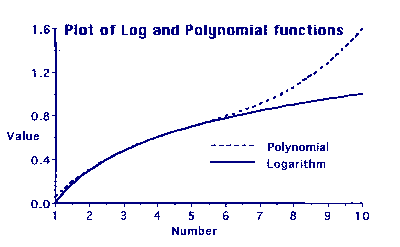
This is quite a good fit when x is between 3 and 5, but fairly dreadful for values higher than 5.
To fit the curve higher up another function has to be used, such as:-
0.00054777x3 - 0.015950x2 + 0.20472x +0.0057011 (Function#2)
This function gives a good fit for values of x between 5 and 8.
The table below shows numbers, their logarithms and the corresponding values of functions #1 & #2.
Where the fit is good, the values are green, whereas red indicates a poor fit.
This is actually a bit of a cheat, because the figures have been cut at three decimal places and differences of 1 in the last place have been ignored to make it easier for me. (This then cunningly ignores the wobble in the middle of function#1).
In practice, the polynomial and the logarithm would have to agree to at least 8 decimal places and it would work for a much smaller range of values. The principle, however, is the same. De Prony's mathematicians would have decided on the functions and their usable ranges and his "computers" would then have been able to start calculating the values of the function for the given range.
| Number | Logarithm | Function#1 | Function#2 |
|---|---|---|---|
| 1.0 | 0.000 | 0.053 | 0.195 |
| 1.2 | 0.079 | 0.110 | 0.229 |
| 1.4 | 0.146 | 0.163 | 0.263 |
| 1.6 | 0.204 | 0.213 | 0.295 |
| 1.8 | 0.255 | 0.259 | 0.326 |
| 2.0 | 0.301 | 0.302 | 0.356 |
| 2.2 | 0.342 | 0.342 | 0.385 |
| 2.4 | 0.380 | 0.380 | 0.413 |
| 2.6 | 0.415 | 0.415 | 0.440 |
| 2.8 | 0.447 | 0.447 | 0.466 |
| 3.0 | 0.477 | 0.477 | 0.491 |
| 3.2 | 0.505 | 0.505 | 0.515 |
| 3.4 | 0.531 | 0.532 | 0.539 |
| 3.6 | 0.556 | 0.557 | 0.562 |
| 3.8 | 0.580 | 0.580 | 0.583 |
| 4.0 | 0.602 | 0.602 | 0.604 |
| 4.2 | 0.623 | 0.623 | 0.625 |
| 4.4 | 0.643 | 0.643 | 0.644 |
| 4.6 | 0.663 | 0.662 | 0.663 |
| 4.8 | 0.681 | 0.681 | 0.681 |
| 5.0 | 0.699 | 0.700 | 0.699 |
| 5.2 | 0.716 | 0.718 | 0.716 |
| 5.4 | 0.732 | 0.736 | 0.732 |
| 5.6 | 0.748 | 0.755 | 0.748 |
| 5.8 | 0.763 | 0.774 | 0.763 |
| 6.0 | 0.778 | 0.793 | 0.778 |
| 6.2 | 0.792 | 0.814 | 0.792 |
| 6.4 | 0.806 | 0.835 | 0.806 |
| 6.6 | 0.820 | 0.858 | 0.820 |
| 6.8 | 0.833 | 0.881 | 0.833 |
| 7.0 | 0.845 | 0.907 | 0.845 |
| 7.2 | 0.857 | 0.934 | 0.857 |
| 7.4 | 0.869 | 0.963 | 0.869 |
| 7.6 | 0.881 | 0.994 | 0.881 |
| 7.8 | 0.892 | 1.027 | 0.892 |
| 8.0 | 0.903 | 1.063 | 0.903 |
| 8.2 | 0.914 | 1.101 | 0.914 |
| 8.4 | 0.924 | 1.142 | 0.925 |
| 8.6 | 0.934 | 1.187 | 0.935 |
| 8.8 | 0.944 | 1.234 | 0.945 |
| 9.0 | 0.954 | 1.285 | 0.956 |
| 9.2 | 0.964 | 1.339 | 0.966 |
| 9.4 | 0.973 | 1.397 | 0.976 |
| 9.6 | 0.982 | 1.459 | 0.986 |
| 9.8 | 0.991 | 1.526 | 0.996 |
| 10.0 | 1.000 | 1.596 | 1.006 |
All those words above are merely details - there is just one important point to recognise.
The next section - The Difference Engine, will show that it is possible to work out the values of a polynomial by using addition and subtraction only. It is not necessary to use multiplication. This makes life a whole lot easier